Van den Heuvel diagrams
Visualize specific index
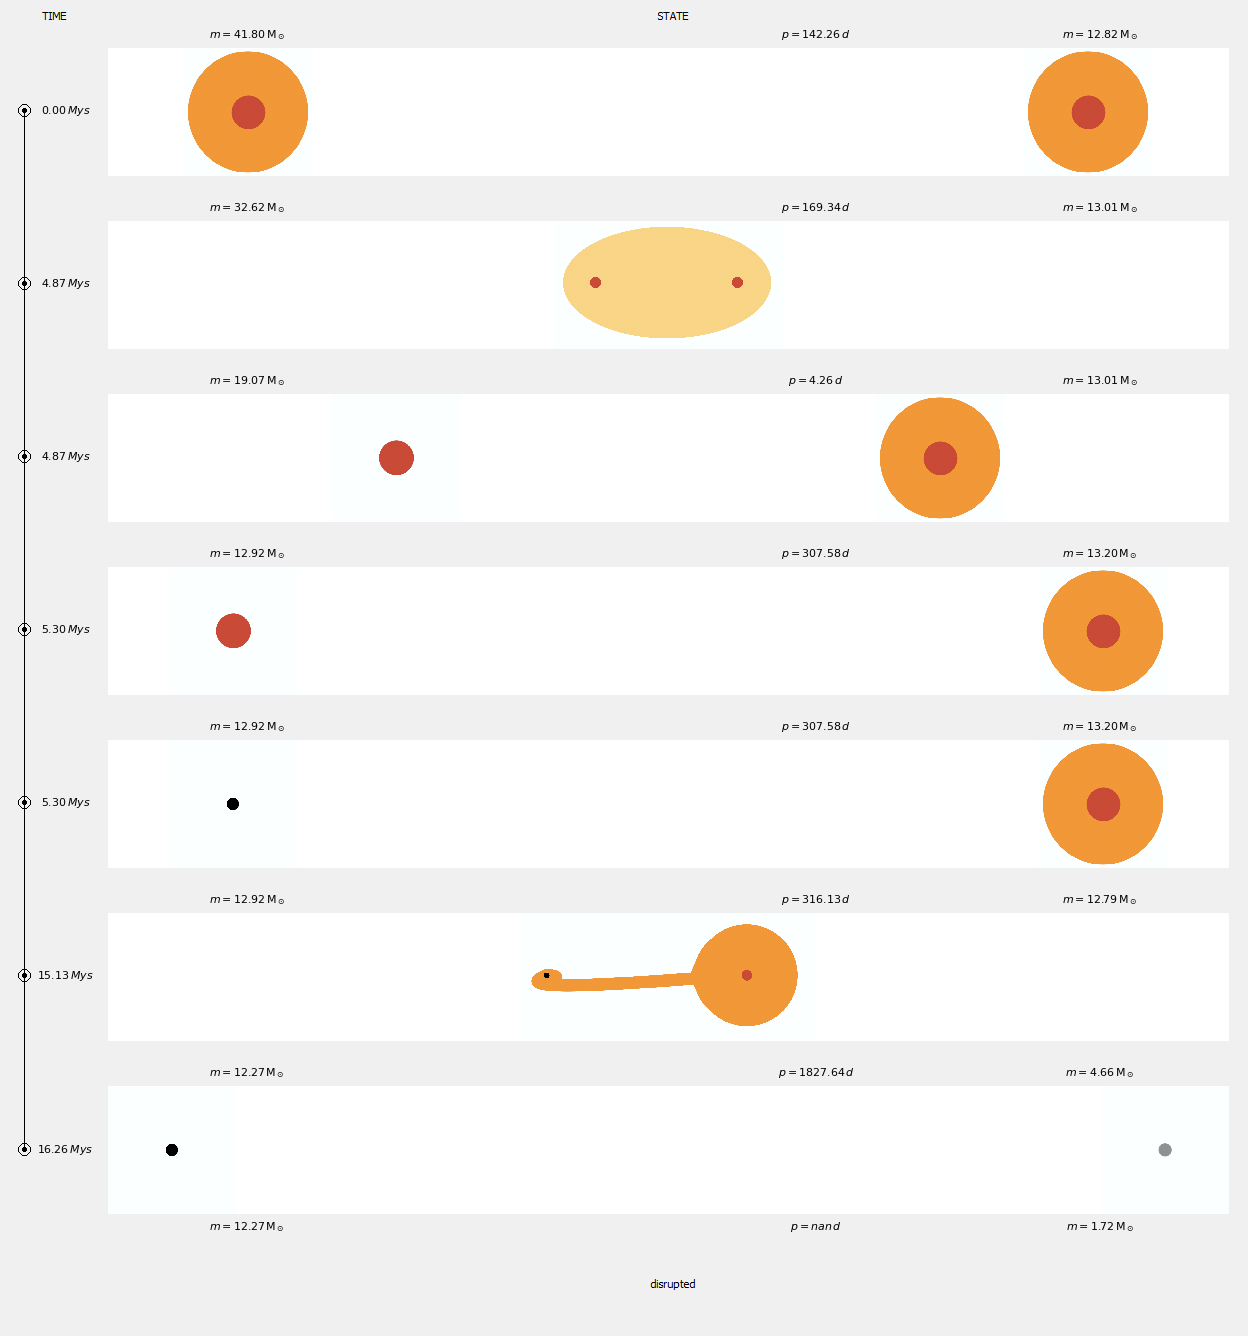
VHdiagrams allow individual POSYDON binaries to be viewed in a more intuitive sense. We use ‘population.h5’ as an example dataset.
Simple usage
The basic usage is to simply visualize one index inside an independent and reactive window, with the following :
from posydon.visualization.VHdiagram import VHdiagram

VHdiagram('population.h5', path='./dataset/', index=18976)
The named parameter ‘path’ is useful if the dataset is in another directory.
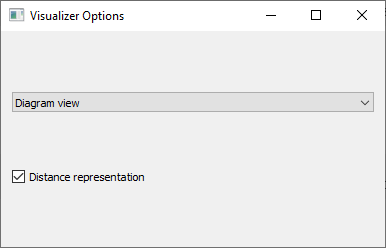
We can choose the view wanted with the option’s window, displayed by ‘option’ button :
The ‘save’ button take a screen of the view currently displayed, and save it inside a ‘screens’ folder, created in the current directory.
Set view
For faster use, it’s possible to directly choose the view displayed. There are 4 available modes:
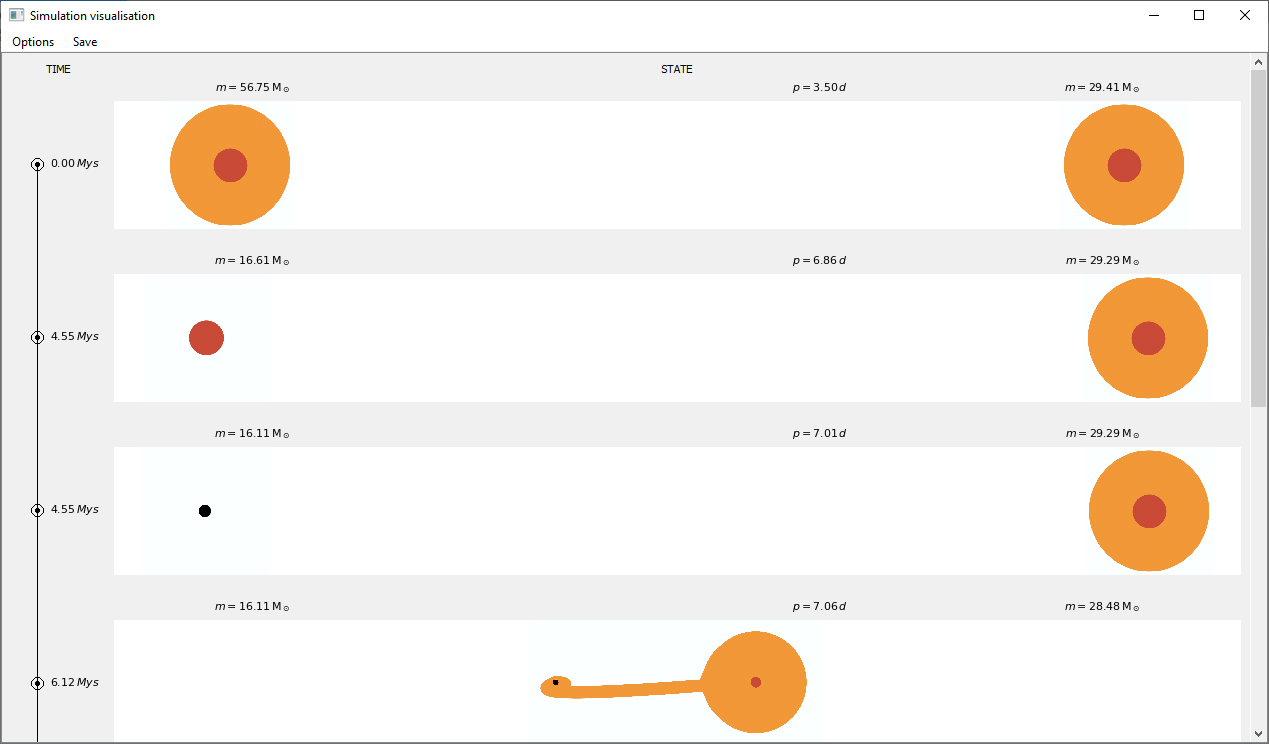
PresenterMode.DIAGRAM
PresenterMode.REDUCED
PresenterMode.SIMPLIFIED
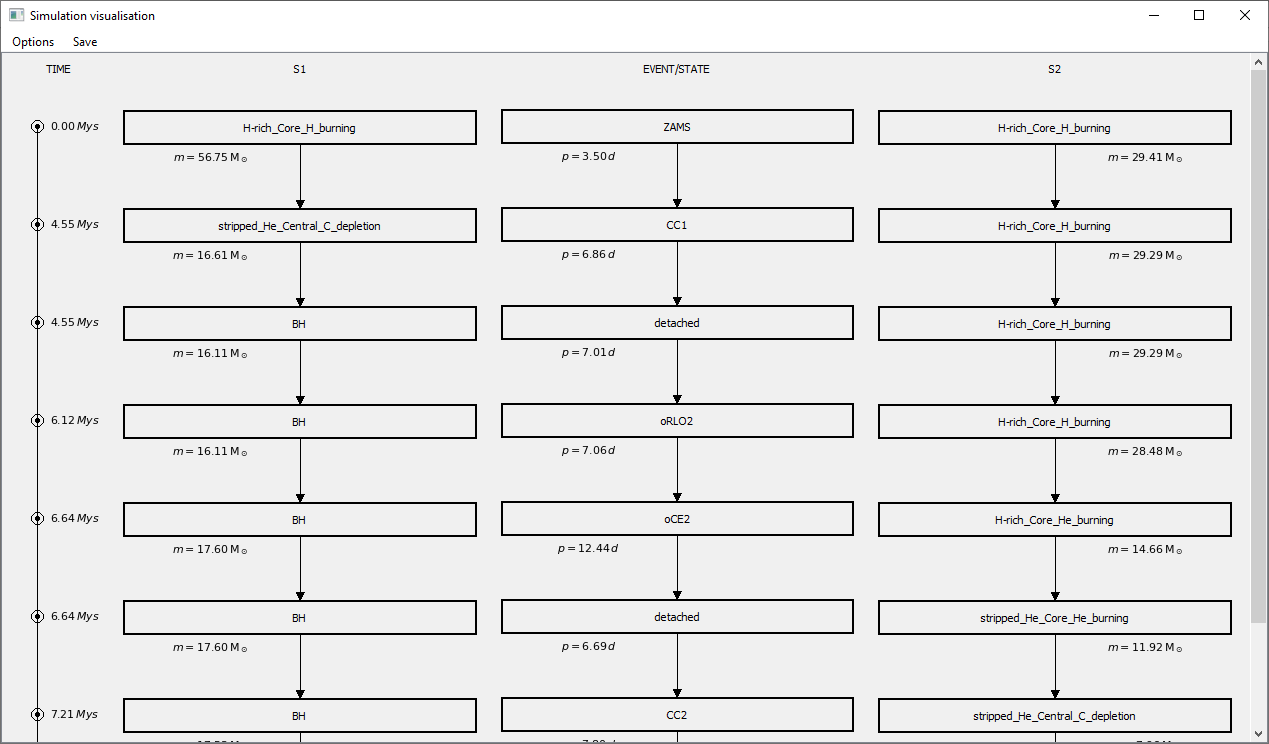
PresenterMode.DETAILED
We can specify which view we want to display with the named parameter ‘presentMode’ :
from posydon.visualization.VHdiagram import VHdiagram
from posydon.visualization.VH_diagram.PresenterMode import PresenterMode

VHdiagram('population.h5', index=19628, presentMode=PresenterMode.DIAGRAM)
Set display mode
There are two ways to display the diagram : inside a window or as a screen inside a Jupyter notebook. There are three available modes:
DisplayMode.INLINE_S
DisplayMode.INLINE_B
DisplayMode.WINDOW
‘INLINE_S’ is to do an inline display with matplotlib while ‘INLINE_B’ use IPython.
We can specify the display mode wanted with the named parameter ‘displayMode’:
from posydon.visualization.VHdiagram import VHdiagram, DisplayMode
from posydon.visualization.VH_diagram.Presenter import PresenterMode

VHdiagram(
    "population.h5",
    index=19628,
    presentMode=PresenterMode.DIAGRAM,
    displayMode=DisplayMode.INLINE_B,
)